Singapore’s busiest MRT stations and line segments (Oct 2025 data)
An analysis of passenger loads and patterns in Singapore’s MRT and LRT network.
Originally published on Medium as “Deep dive of Singapore’s rail network passenger loads” on 18 January 2026.
TL;DR
Here’s a condensed summary of all the stats for peak periods on weekdays in October 2025:
- Busiest MRT line: North East Line
- Interchange with most transfers, AM: Jurong East, North-South Line to East-West Line
- Interchange with most transfers, PM: Jurong East, East-West Line to North-South Line
- Busiest line segment, AM: Kovan to Serangoon, North East Line
- Busiest line segment, PM: Serangoon to Kovan, North East Line
- Busiest station, AM: Jurong East
- Busiest station, PM: Jurong East
- Busiest non-interchange station: Tanjong Pagar at 6pm
- Station with largest net inflow, AM: Serangoon
- Station with largest net inflow, PM: Raffles Place
- Station with largest net outflow, AM: Raffles Place
- Station with largest net outflow, PM: Yishun
Update @ 22 Jan 2026: u/ylyn pointed out a crucial flaw in my original method when assigning passenger loads to segments. I have corrected the error in my re-computations, resulting in corrected tables, naturally leading to different analysis and conclusions for most of the article, less the inflow/outflow and non-interchange sections.
I’m back with another deep dive of Singapore’s public transport! You can take a look at my previous articles about buses here and here.
This time, we will be taking a look at the passenger loads of the rail network — both MRT and LRT. However, I think it is quite intuitive that the MRT loads will generally outweigh the LRT loads, simply because of the capacity of the trains, as well as the number of stations and coverage that they offer.
Like the previous articles, I’ve taken the data mainly from LTA DataMall (and some other sources) and did some data analysis and processing to get some interesting metrics that we can really look into. For a more detailed write-up on the data processing methodologies, assumptions, and the metrics that I ended up with, look at the accompanying write-up here: Appendix — Deep dive of Singapore’s rail network passenger loads.
We’ll be looking at the statistics from October 2025, one of the months without any major disruptions affecting day-to-day commuter patterns. We’ll also be mainly looking at AM and PM peak periods on weekdays for this article, following the LTA definition of 6.30am to 8.30am for AM peak, and 5pm to 7pm for PM peak. In the tables, the hour of day is the hour the count starts in, so 8am means 8:00 to 8:59am.
Overall MRT/LRT line metrics
| Line | Average load of whole line per hour | Stations | Average load between stations per hour |
|---|---|---|---|
| North East Line | 309,780 | 17 | 9,681 |
| North-South Line | 472,653 | 27 | 9,089 |
| East-West Line | 557,641 | 33 | 8,713 |
| Circle Line | 219,670 | 28 | 4,068 |
| Downtown Line | 255,605 | 35 | 3,759 |
| Thomson-East Coast Line | 124,003 | 27 | 2,385 |
| Changi Airport Branch Line | 6,901 | 3 | 1,725 |
| Bukit Panjang LRT | 19,469 | 13 | 811 |
| Sengkang LRT | 16,173 | 14 | 622 |
| Punggol LRT | 15,878 | 15 | 567 |
| Circle Line Extension | 2,102 | 3 | 526 |
We can see in the table above the overall metrics for all of the MRT and LRT lines in terms of average passenger loads per hour, in both directions of the line. However, each line obviously has a different number of stations. Therefore, it is more useful to compute the average load between stations (“line segments”) for a more apples-to-apples comparison.
Unsurprisingly, we see the North East Line (NEL), North-South Line (NSL), and East-West Line (EWL) dominating the top 3 passenger load densities in that order, simply because these lines connect up pretty much all the large residential estates, bus-MRT interchanges, business districts and industrial parks. I’d like to call these the major MRT lines of the rail network as they carry the bulk of the passengers on a daily basis.
The next tier of lines would be the Circle Line (CCL), Downtown Line (DTL) and the Thomson-East Coast Line (TEL), which carry less than half the passenger load of the major MRT lines. These are what I would call the supplementary MRT lines, supporting the movement of passengers between the major MRT lines, as well as providing access to locations that aren’t covered by the major MRT stations.
Last but not least, there are the LRT/MRT lines which I would call the feeder lines, if we were to draw parallels to the public bus system. I would think this naming is pretty self-explanatory, since the LRTs are focused on moving passengers around their respective estates, while the extensions are also just branches off the main lines that serve a slightly different location. In the rest of the tables, I’ll refer to the Bukit Panjang, Sengkang and Punggol LRT lines as BPLRT, SKLRT and PGLRT respectively.
Weekday AM and PM peak transfers at MRT interchanges
We now look at the transfer figures at the MRT interchanges. I would like to highlight that these numbers aren’t actually recorded and made publicly available in the LTA DataMall datasets, so these are just approximations and estimations. Again, if you’d like to go into more detail on how I went about these estimations, please do read the accompanying appendix article!
Weekday AM peak transfers
| Station | From | To | Hour | Transfers |
|---|---|---|---|---|
| Jurong East | NSL | EWL | 7am | 23,078 |
| Jurong East | NSL | EWL | 8am | 15,997 |
| Raffles Place | NSL | EWL | 8am | 12,209 |
| Serangoon | NEL | CCL | 7am | 9,531 |
| Dhoby Ghaut | NEL | NSL | 8am | 8,809 |
| Bishan | NSL | CCL | 7am | 8,746 |
| Serangoon | NEL | CCL | 8am | 8,284 |
| Jurong East | NSL | EWL | 9am | 7,447 |
| Bishan | NSL | CCL | 8am | 7,389 |
| Raffles Place | NSL | EWL | 7am | 7,211 |
Weekday PM peak transfers
| Station | From | To | Hour | Transfers |
|---|---|---|---|---|
| Jurong East | EWL | NSL | 6pm | 14,063 |
| Jurong East | EWL | NSL | 5pm | 13,418 |
| Serangoon | CCL | NEL | 6pm | 11,684 |
| Serangoon | CCL | NEL | 5pm | 10,260 |
| Bishan | CCL | NSL | 6pm | 8,695 |
| Jurong East | EWL | NSL | 7pm | 7,423 |
| Bishan | CCL | NSL | 5pm | 7,335 |
| Buona Vista | CCL | EWL | 6pm | 7,245 |
| Dhoby Ghaut | NSL | NEL | 6pm | 7,071 |
| Paya Lebar | CCL | EWL | 6pm | 6,686 |
From these interchange transfer figures, we can tell that Jurong East is in a different league of business altogether compared to the other interchange stations. This is not really surprising because of two reasons. The first reason is because Jurong East is an interchange for 2 major MRT lines — NSL and EWL. The second reason is because Jurong East is pretty much the only MRT interchange in the western part of Singapore. Therefore, it constantly receives the bulk of the MRT transfers there, as compared to the more centrally located stations like Raffles Place or Dhoby Ghaut, where the loads are spread out over several stations.
We can also see quite obviously the role of CCL shifting passengers to and from the major lines. Another interesting observation to point out is the shift in transfer patterns from AM to PM peak. We see transfers from the major lines to CCL in the mornings, and vice versa with CCL transfers to major lines dominating in the evenings. An explanation of this could be due to the stations along the CCL which have significant business and educational locations, such as one-north, Labrador Park, Tai Seng and Kent Ridge, to name a few.
Busiest line segments
We now look at the busiest line segments throughout the rail network, which are defined by the passenger loads between immediately adjacent stations in a line. I’ve bolded and italicised station names which are also interchanges.
Weekday AM busiest line segments
| Line | From | To | Hour | Segment load |
|---|---|---|---|---|
| NEL | Kovan | Serangoon | 8am | 30,173 |
| NEL | Kovan | Serangoon | 7am | 28,734 |
| NEL | Hougang | Kovan | 8am | 28,444 |
| NEL | Farrer Park | Little India | 8am | 28,365 |
| NEL | Boon Keng | Farrer Park | 8am | 27,985 |
| NEL | Potong Pasir | Boon Keng | 8am | 27,417 |
| NEL | Hougang | Kovan | 7am | 27,369 |
| NEL | Woodleigh | Potong Pasir | 8am | 27,124 |
| NEL | Little India | Dhoby Ghaut | 8am | 26,961 |
| NSL | Ang Mo Kio | Bishan | 7am | 26,741 |
Weekday PM busiest line segments
| Line | From | To | Hour | Segment load |
|---|---|---|---|---|
| NEL | Serangoon | Kovan | 6pm | 27,353 |
| NEL | Little India | Farrer Park | 6pm | 26,270 |
| NSL | Bishan | Ang Mo Kio | 6pm | 25,794 |
| NEL | Dhoby Ghaut | Little India | 6pm | 25,791 |
| EWL | Buona Vista | Dover | 6pm | 25,339 |
| NEL | Kovan | Hougang | 6pm | 25,283 |
| EWL | Dover | Clementi | 6pm | 25,216 |
| NEL | Farrer Park | Boon Keng | 6pm | 24,374 |
| NEL | Boon Keng | Potong Pasir | 6pm | 24,303 |
| NEL | Potong Pasir | Woodleigh | 6pm | 24,296 |
Based on what we know about the load densities of NEL in particular, I think it is of no surprise that its line segments are generally the busiest during both AM and PM peak due to high demand. What this additional information tells us is exactly which portions along the lines are the most crowded.
In the AM peak, the Kovan-Serangoon segment is consistently the highest loaded, followed by its neighbouring segments Hougang-Kovan upstream from Punggol Coast, and downstream surrounding Potong Pasir, Boon Keng and Farrer Park. This would imply that there is a funnelling effect from the major towns of Punggol, Sengkang and Hougang. There is some release of about 8–9k passengers per hour at Serangoon interchange to the CCL, but there is also a large number of passengers boarding as well, as we’ll see in the later section about stations with large inflows. Therefore, the NEL still maintains a pretty heavy load downstream up until the Little India and Dhoby Ghaut interchanges. We can effectively see the mirror image of this effect during the PM peak.
I think also what’s interesting is that we see the Buona Vista-Dover-Clementi segments being very heavily loaded during the PM peak, but not so much during the AM peak. Again, I would attribute it to the concentration of working crowd just heading back home from the CCL stations near offices and industrial estates, changing to the EWL at Buona Vista, and likely heading towards the estates westwards of Clementi on EWL, and estates on NSL north of Jurong East.
Busiest stations
We now look at the busiest stations in the rail network. For this article, I’ve defined the level of passenger load in a station to be
Station load = # of entries + # of exits + # of transfers (if it is an interchange station)
Weekday AM busiest stations
| Station | Lines | Hour | Load |
|---|---|---|---|
| Jurong East | NSL EWL | 7am | 38,458 |
| Raffles Place | NSL EWL | 8am | 33,434 |
| Jurong East | NSL EWL | 8am | 30,025 |
| Outram Park | EWL NEL TEL | 8am | 25,238 |
| Raffles Place | NSL EWL | 9am | 22,205 |
| Outram Park | EWL NEL TEL | 7am | 21,949 |
| Serangoon | NEL CCL | 7am | 21,395 |
| Serangoon | NEL CCL | 8am | 21,085 |
| Bishan | NSL CCL | 7am | 20,917 |
| Dhoby Ghaut | NSL NEL CCL | 8am | 20,362 |
Weekday PM busiest stations
| Station | Lines | Hour | Load |
|---|---|---|---|
| Jurong East | NSL EWL | 6pm | 39,245 |
| Jurong East | NSL EWL | 5pm | 33,303 |
| Raffles Place | NSL EWL | 6pm | 30,514 |
| Serangoon | NEL CCL | 6pm | 27,984 |
| Outram Park | EWL NEL TEL | 6pm | 27,848 |
| Dhoby Ghaut | NSL NEL CCL | 6pm | 26,581 |
| City Hall | NSL EWL | 6pm | 22,951 |
| Outram Park | EWL NEL TEL | 5pm | 22,735 |
| Paya Lebar | EWL CCL | 6pm | 22,627 |
| Jurong East | NSL EWL | 7pm | 22,167 |
Based on how the station load is defined, it would be intuitive to think that interchanges would dominate the ranks of busiest stations. Indeed, the numbers from the table confirm the intuition.
Looking across both lists, we also see that the busiest stations are generally interchanges that involve at least one of the major lines, with the top of the table being interchanges that involve two major lines. That is something we would have expected based on the previous metrics on the busiest interchanges as well.
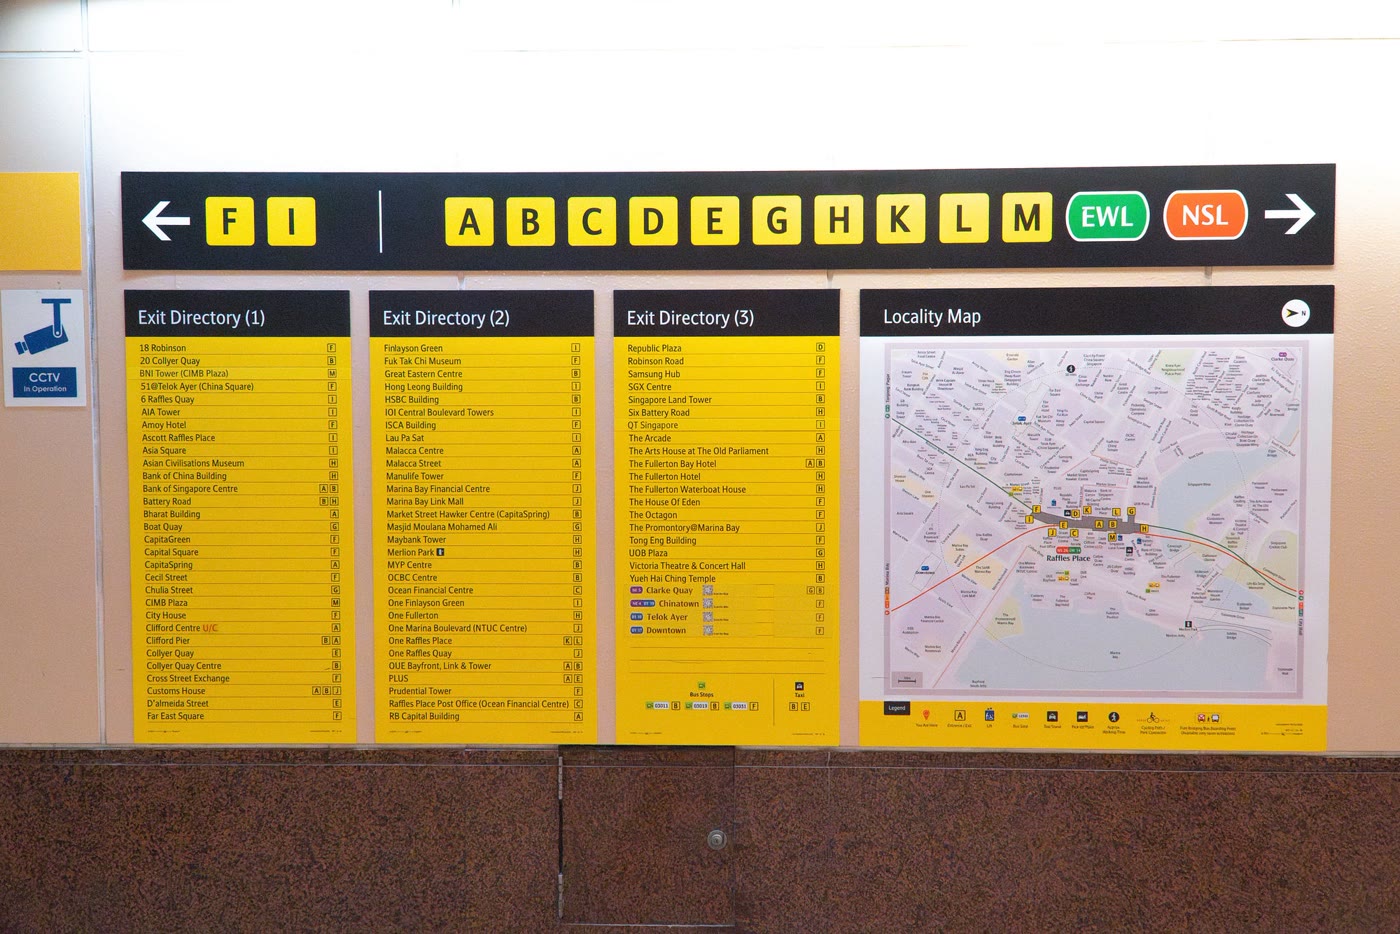
I think it’s also worth highlighting the difference between the busiest and most crowded stations. “Busyness” is basically a counting statistic, answering the question of how many passengers use an MRT station. For crowdedness, it’s really about the ratio of the number of passengers in a station to its size, similar to the concept of density. A station could be really busy like Raffles Place, but due to the vast area, multiple platforms and numerous exits (13 from A to M!) that the station covers, it might not be perceived as very crowded. To contrast, a station like Boon Lay that is a standard-sized above-ground station with only two levels and one platform could be experienced very differently during peak periods, even when the absolute busyness loads are less than that of Raffles Place.
Busiest non-interchange stations
In the same vein, I think it will also be interesting to just look at the busiest non-interchange stations, across both AM and PM peak. I came across a Reddit thread on r/AskSingapore discussing the same question, so I thought that we can use some data to back it up.
| Station | Line | Hour | Load |
|---|---|---|---|
| Tanjong Pagar | EWL | 6pm | 13,475 |
| Yishun | NSL | 6pm | 12,436 |
| Boon Lay | EWL | 6pm | 12,383 |
| Clementi | EWL | 6pm | 11,810 |
| Tanjong Pagar | EWL | 8am | 11,311 |
| Admiralty | NSL | 7am | 10,801 |
| Boon Lay | EWL | 7am | 10,647 |
| Yishun | NSL | 7am | 10,355 |
| Sembawang | NSL | 7am | 10,186 |
| Ang Mo Kio | NSL | 6pm | 10,071 |
Again unsurprisingly, most of these stations are on either the EWL or NSL. The top comment by u/everraydy rather accurately points out Clementi and Boon Lay as busy stations, coming in 4th and 3rd respectively during the peak evening period at 6pm.
Stations with the largest net inflow of passengers
Now, we look at the MRT stations in terms of the largest net inflow of passengers in the peak periods. A large inflow of passengers implies that there is a large source of passengers entering the particular station as their first point of entry to the MRT network. Those at the top of the table imply a large demand for that particular station, either due to its particular location or the lack of convenient or alternative public transportation options around it.
Weekday AM highest net inflow
| Station | Lines | Hour | Net inflow |
|---|---|---|---|
| Serangoon | NEL CCL | 8am | 5,559 |
| Yishun | NSL | 7am | 5,247 |
| Admiralty | NSL | 7am | 5,201 |
| Sengkang | NEL SKLRT | 8am | 4,870 |
| Punggol | NEL PGLRT | 8am | 4,848 |
| Bishan | NSL CCL | 8am | 4,532 |
| Sembawang | NSL | 7am | 4,521 |
| Tampines | EWL DTL | 8am | 4,376 |
| Punggol | NEL PGLRT | 7am | 4,346 |
| Khatib | NSL | 8am | 4,298 |
For the AM peak period, we see the residential estates topping the table for the largest net inflow of passengers, which are mainly stations on the NEL (Serangoon, Punggol, Sengkang) and NSL (Yishun, Admiralty, Bishan, Sembawang, Khatib), as well as Tampines on the EWL/DTL being the outlier.
This makes sense as the general commuter patterns in the morning peak mean that most people are leaving their homes to travel to their workplaces. The reason why these stations appear in this table, as compared to other large residential estates on the EWL like Clementi or Bedok, is likely due to the lack of alternative convenient transportation options in the area. For the majority of the towns on the EWL, especially in the eastern region of Singapore, most commuters could also have the DTL and TEL as alternative MRT station options, given that these 3 lines almost run in parallel for the most part.
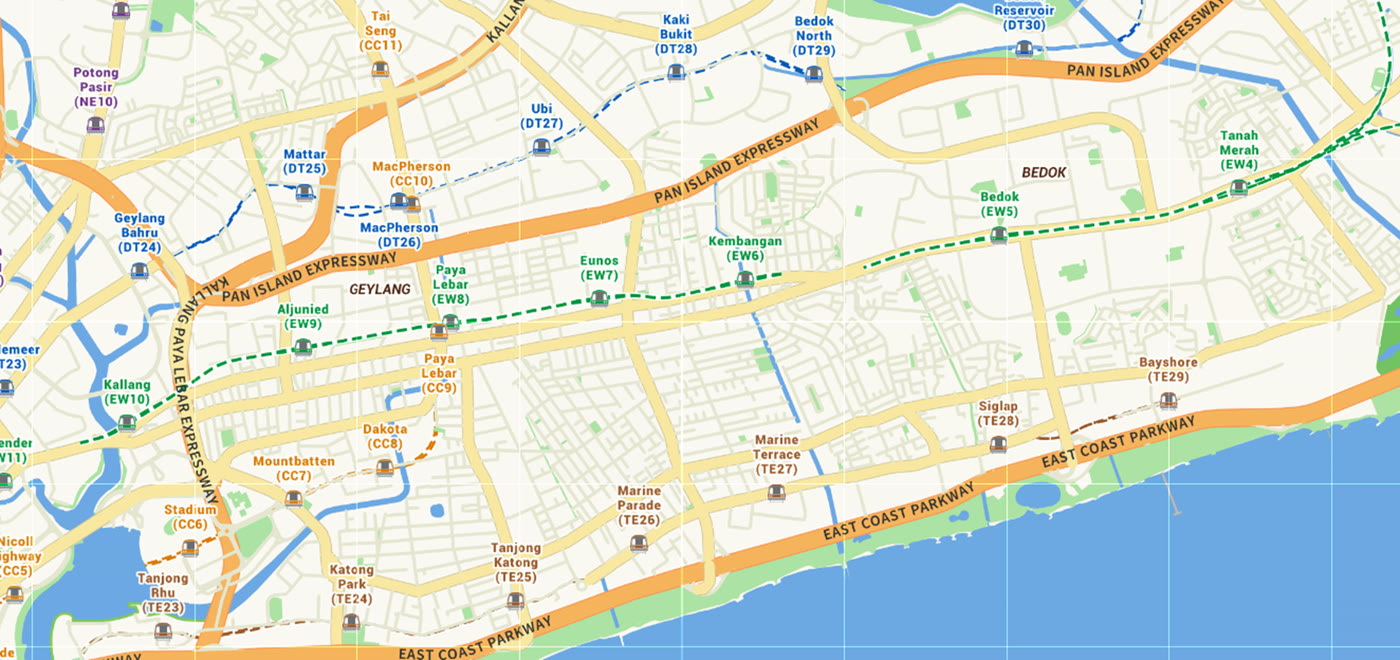
For most of the stations along the NSL and NEL, there are really no other alternative MRT lines to speak of, especially if the destination is towards the central/CBD region. The only other viable public transportation option is taking the bus, but unless you’re taking the express (or routes with significant sectors on expressways), or City Direct routes, the additional travel time compared to using the MRT isn’t really worth it. And besides, the capacities of the buses are pretty limited compared to trains, so it really just makes more sense to take the train if you’re concerned about waiting times.
Weekday PM highest net inflow
| Station | Lines | Hour | Net inflow |
|---|---|---|---|
| Raffles Place | NSL EWL | 6pm | 15,001 |
| Tanjong Pagar | EWL | 6pm | 8,045 |
| Raffles Place | NSL EWL | 5pm | 7,671 |
| Raffles Place | NSL EWL | 7pm | 6,575 |
| Downtown | DTL | 6pm | 5,961 |
| Outram Park | EWL NEL TEL | 5pm | 4,825 |
| Tanjong Pagar | EWL | 5pm | 4,613 |
| Novena | NSL | 5pm | 4,600 |
| Kent Ridge | CCL | 6pm | 4,452 |
| Kent Ridge | CCL | 5pm | 4,398 |
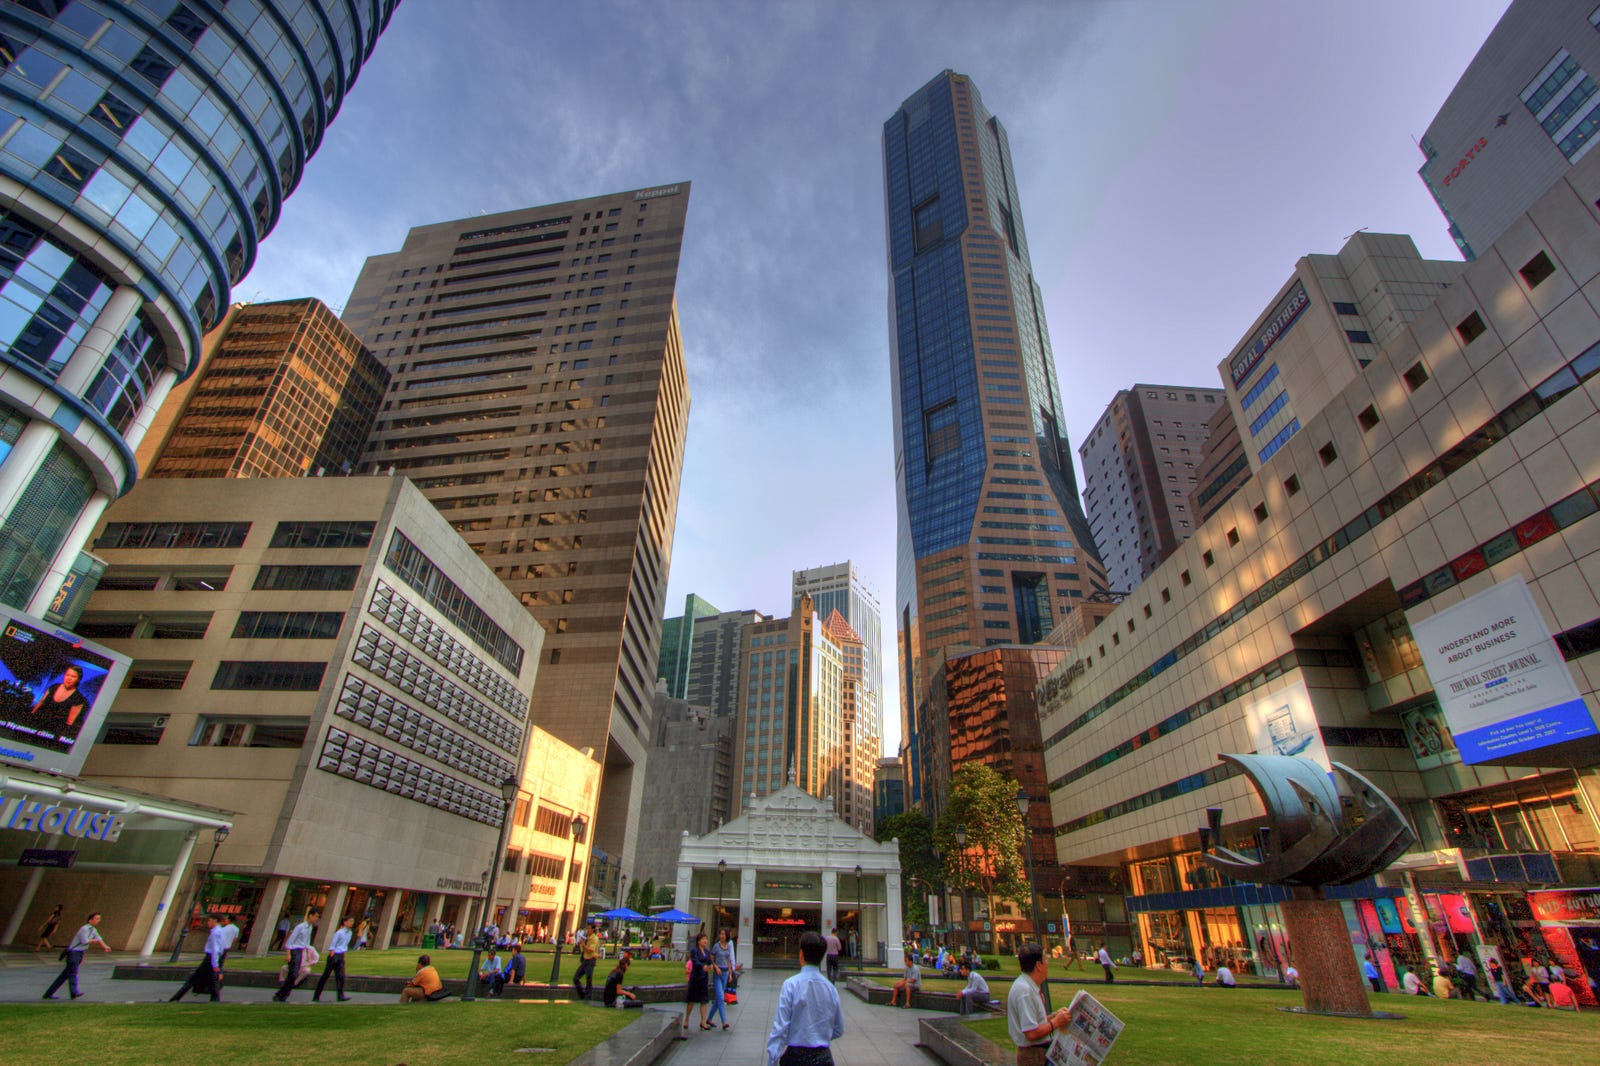
For the PM peak period, the large net inflow of passengers is from workers leaving their workplaces. Therefore, we see most of the stations being in the CBD/city area, with Raffles Place, Tanjong Pagar and Downtown leading the table. Raffles Place station in particular is in a league of its own, having almost twice as much influx of passengers compared to the 2nd place Tanjong Pagar station. I think it is pretty self-explanatory: Raffles Place is the station when you think of the CBD or financial district, and with it comes its large crowds of office workers knocking off work from all of the numerous tall buildings in the area.

An interesting outlier in the table is actually Kent Ridge station. It is not an interchange station, and it isn’t in the central CBD region of Singapore, but yet it is in the table. This is because it is the main MRT station that connects directly to the National University of Singapore (NUS) and its public hospital, National University Hospital (NUH). In addition, it also serves the Science Park industrial park area. This makes Kent Ridge effectively a major decentralised office area, outside of the CBD. Personally, I’m a regular user of the Kent Ridge station and I can attest to its crowdedness on weekday evenings.
Stations with the largest net outflow of passengers
For the largest net outflow of passengers in the peak periods, we would intuitively think that it’s the inverse pattern compared to the net inflow patterns we saw in the previous section. In other words, stations with the largest net inflow in the AM peak will see the largest net outflow in the PM peak. This is what I call the conservation of passenger flow. We’ll look at the tables to see if that is true.
Weekday AM highest net outflow
| Station | Lines | Hour | Net flow |
|---|---|---|---|
| Raffles Place | NSL EWL | 8am | −16,336 |
| Raffles Place | NSL EWL | 9am | −13,667 |
| Tanjong Pagar | EWL | 8am | −9,514 |
| Tanjong Pagar | EWL | 9am | −7,633 |
| Downtown | DTL | 8am | −6,461 |
| Novena | NSL | 8am | −5,783 |
| Downtown | DTL | 9am | −5,756 |
| Jurong East | NSL EWL | 8am | −5,603 |
| Kent Ridge | CCL | 8am | −5,481 |
| Tai Seng | CCL | 8am | −5,385 |
Weekday PM highest net outflow
| Station | Lines | Hour | Net flow |
|---|---|---|---|
| Yishun | NSL | 6pm | −5,900 |
| Woodlands | NSL TEL | 6pm | −5,441 |
| Serangoon | NEL CCL | 6pm | −4,821 |
| Tampines | EWL DTL | 6pm | −4,521 |
| Yishun | NSL | 7pm | −4,340 |
| Woodlands | NSL TEL | 7pm | −4,182 |
| Sengkang | NEL SKLRT | 6pm | −4,059 |
| Bukit Panjang | DTL BPLRT | 6pm | −3,730 |
| Punggol | NEL PGLRT | 6pm | −3,530 |
| Sembawang | NSL | 7pm | −3,464 |
In general, we see that the stations with the largest net outflow in the morning (Raffles Place, Tanjong Pagar, Downtown) are similar to the ones with the largest net inflow in the evening, confirming the conservation of passenger flow.
Similarly, the reverse is also true, where stations with the largest net outflow in the evening are the stations near residential areas (Yishun, Serangoon, Sengkang) and are also the ones with the largest net inflow in the mornings.
An exception appears to be Woodlands station having a large outflow of passengers in the evening, which did not show up in the previous section on stations with large net inflow of passengers. However, this could potentially be explained by Woodlands’ proximity to Admiralty — in fact, Woodlands is seen as the estate’s central region, with Admiralty being sort of like Woodlands East, and Marsiling being Woodlands West. My theory is that most of the residents living in the larger Woodlands area tend to exit at Woodlands station to either do some errands (groceries, food takeaways etc), before making the last mile home either by bus or by foot.
Thoughts and conclusions
My take is that what most people experience while taking the MRT is reflective of what we see in the numbers and metrics here — that the NEL, NSL and EWL trains and stations are generally the busiest during the peak hours.
What surprised me was the sheer loading of the NEL train segments around Serangoon and all the way downstream till Dhoby Ghaut. This tells me that the demand is extremely strong along the line. Perhaps that is why so many City Direct buses serving the estates on the NEL have been launched.
The stats about Jurong East just consistently being the busiest MRT interchange with the most transfers just underscores how crucial (and crowded) it is as a transport node in the western region of Singapore. I’m interested to see if this would change once the Jurong Region Line opens up, to distribute the transfer loading to either Choa Chu Kang or Boon Lay.
The stations having the most inflow and outflow make intuitive sense for me, especially the ones in the CBD where obviously there’s a higher concentration of office workers. What stood out to me was Yishun being consistently high in the AM inflow and PM outflow, which means that it is a very populous town, with very few alternatives for other MRT stations (due to its geographical location) or even alternative modes of public transport that can bring passengers in and out of the estate. In another article, I might try to look deeper at why some stations in certain estates have a higher demand than others.
Also, with the opening of the Circle Line extension planned to be in 2026, I’m also curious to see the impact it would have on the passenger loading patterns on both the NEL and NSL, given that it connects up both of the terminus stations of HarbourFront and Marina Bay.
Get the next deep dive by email
New analyses of Singapore's buses and trains, a few times a year. No spam, unsubscribe anytime.
Or follow via RSS.
Enjoyed this article? Leave a like!
0 likes